Showing posts with label Statistics. Show all posts

Friday, March 27, 2009

What's the Deal with the Economy?


Intriguing, cool interactive graphic over at Russel.com. Definitely visit to dig down and learn about all these indicators, what they are, and what they mean. Maybe you can explain it to me, because I don't know what the hell I'm looking at here.

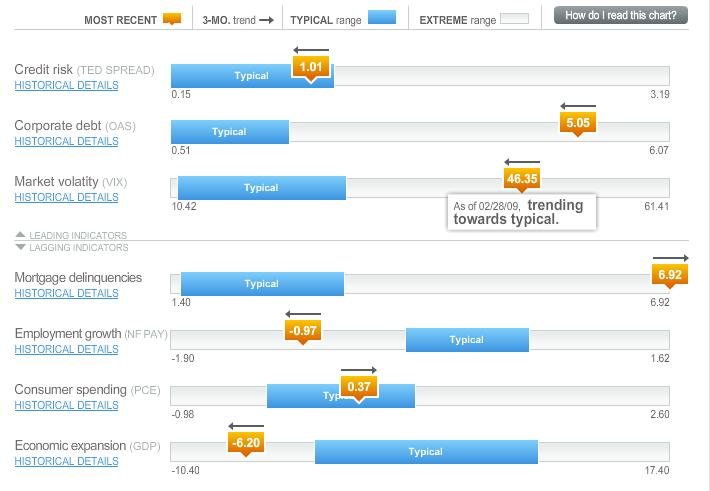
Leading indicators trending toward (although a ways off from) typical, at least. So we've got that going for us.

Hm, upon examining closer it looks like the data is as of 2/28...which makes sense. In a few days we should be able to get the numbers from March. You can subscribe to an email update if you follow this link.

Via Ritholz @ The Big Picture - a must-read (good mix of broad analysis of the financial crisis, interviews, guest authors, in-depth market/investing stuff, and a fair amount of humorous bits as well) during these tumultuous times.

Hat tip to RAW for turning me on to that blog. (Who still has to answer the email I sent him about...two weeks ago? WTF, man?)

Tuesday, March 10, 2009

EconomPic Data

I recently came across this very cool blog: EconomPic Data. Author Jake posts a ton of graphs about all sorts of economic data - import/export ratios, equity vs. bond returns, box office returns, U.S. budget deficit - on a frequent basis. Check it out.

As an example of what you can find there, here's a somewhat (darkly) humorous graph representing AIG's loss per second:

Friday, October 31, 2008

Does Your Vote Matter?

A nice article in Slate on why, despite the long odds, it does.

The upshot? Vote.

Saturday, October 18, 2008

Good Luck Next Year(s), Mets Fans!

Via FJM.

On his first full day as the Mets' long-term manager, Manuel forcefully attacked the SABR-type mathematical analysis some have fixated on in recent years.

"You get so many statistical people together, they put so many stats on paper, and they say, well, if you do this and you score this many runs, you do that many times, you'll be in the playoffs," he said.

"That's not really how it works, and that's what we have to get away from. And that's going to have to be a different mind-set of the team in going forward. We must win and we must know how to win rather than win because we have statistical people. We have to win because we have baseball players that know and can understand the game."
Stats & logic, we hardly knew ye.

Addendum: Yes, chezmrhe.com is just an RSS reader for your FJM subscription!

Monday, July 7, 2008

Secession Is a Fat Man's Game

Latest from Strange Maps: a map of the US and the states' obesity as a percentage of the population. No surprise that the South is maintaining a comfortable lead what with all the Waffle Houses on every corner.

Mississippi - the true home of Fatt E. McButterpants?

Sunday, July 15, 2007

You'd Think I Could Find One...


Yet another interesting map over at that unique blog, Strange Maps. This shows the disparity between single men and women, which is very much a West/East coast split.

Perhaps I should postpone that move to California?

Friday, July 13, 2007

IPS Correlates With Other Stats

On the heels of the Sox' kicking off the 2nd half of the season with a nice win last night, Fire Brand of the AL has an interesting post about the Sox starters. He takes a look at the innings pitched per start for each of the regular starters in comparison to the rest of MLB, and according to his metrics, Matsuzaka is the Sox' "true #1" with Beckett, Schill, and Wakefield ranking as "true #2" pitchers. He also finds that IPS correlates positively with other pitching stats - not too surprising, perhaps, but good stuff.